Infrastructure
The Buildout
Satellite imagery reveals how AI data centers are reshaping the American landscape — from factory floors to server halls, farmland to construction sites — in months, not years.
Abilene, Texas. Two years ago this was open farmland on the edge of a drought-prone city. Today it's an active construction site for Stargate — a $500 billion AI campus that, when complete, will consume more electricity than Pittsburgh and nearly four million gallons of water every day. Drag the slider. Across the country, the same transformation is rewriting the American landscape in months, not years.
Stargate's planned Abilene campus will draw ~500 megawatts of power and an estimated ~4.8M gallons of water per day — in one of Texas's most drought-prone regions.
How much power is that?
Megawatt numbers are easy to gloss over. Here's how the largest AI data centers compare to familiar references.
MW = megawatts of continuous power draw. A single large AI training campus now rivals an entire mid-sized American city — or a nuclear reactor — in electricity demand.
OpenAI / Oracle / SoftBank
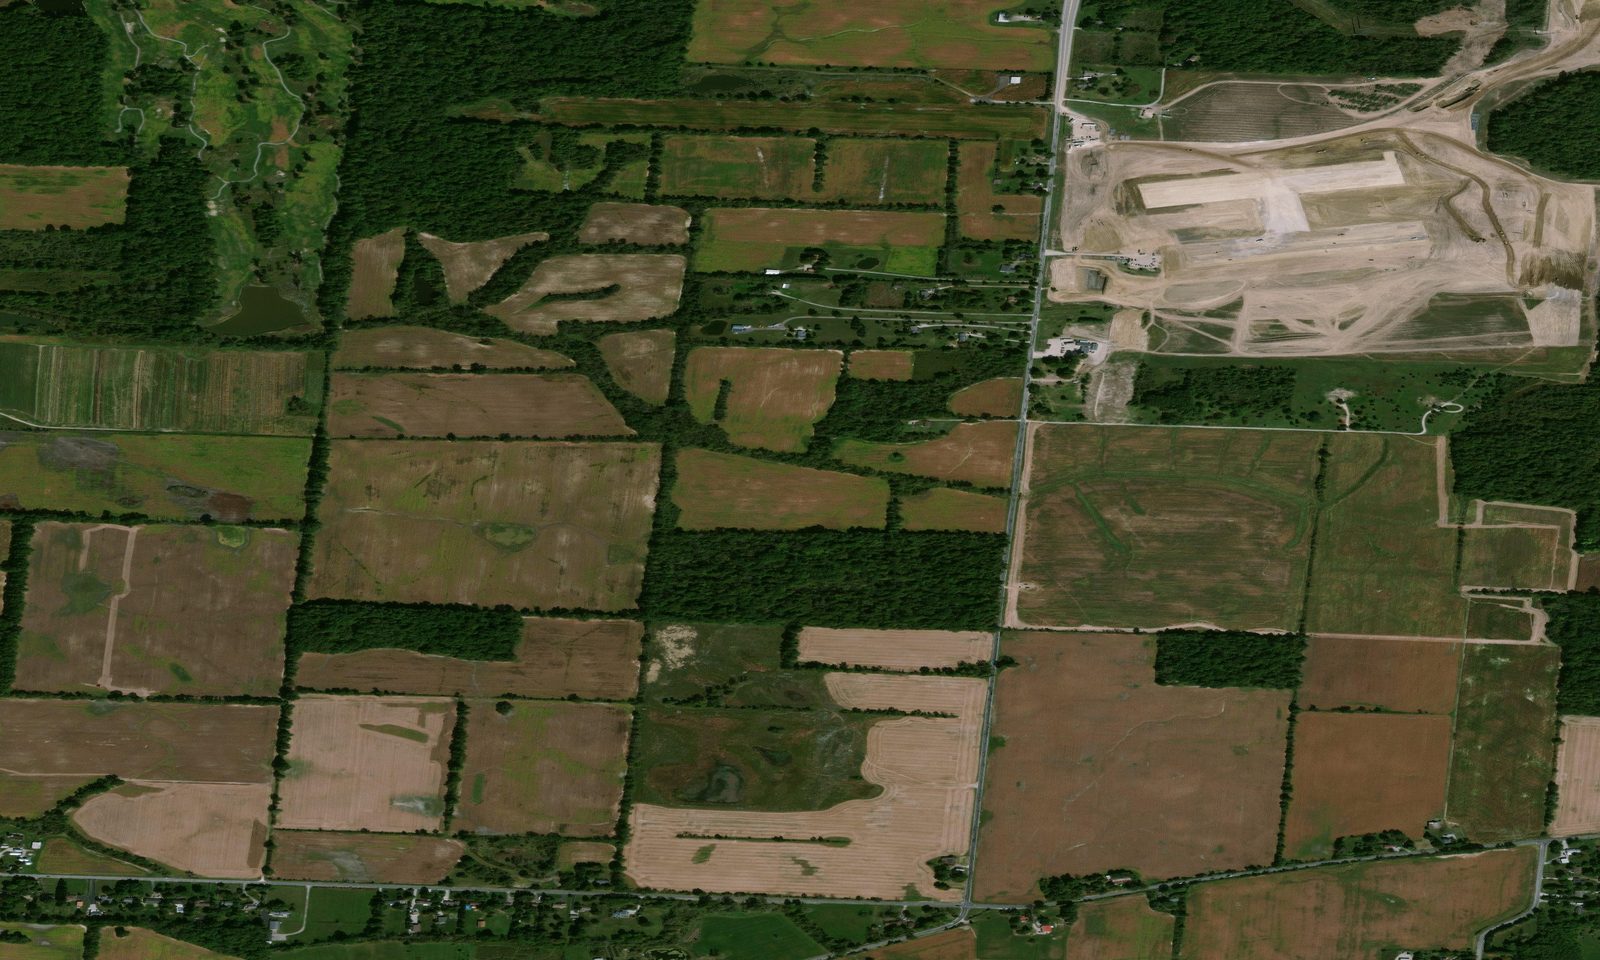
Abilene, Texas
Open Farmland → Stargate AI Campus ($500B Project)
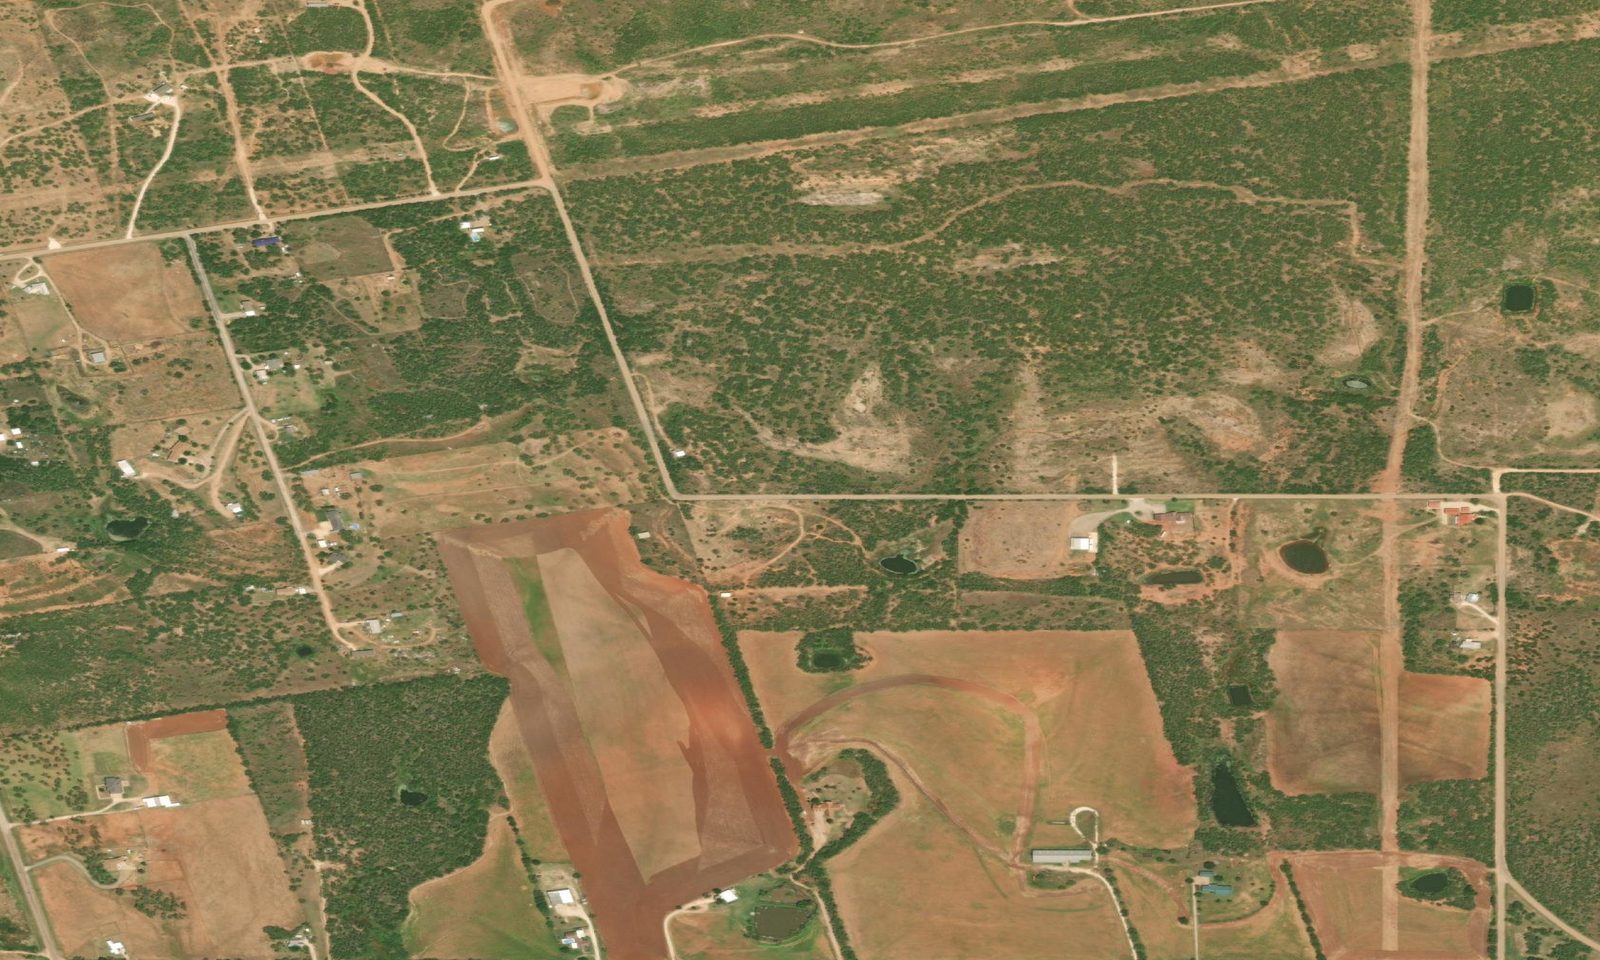
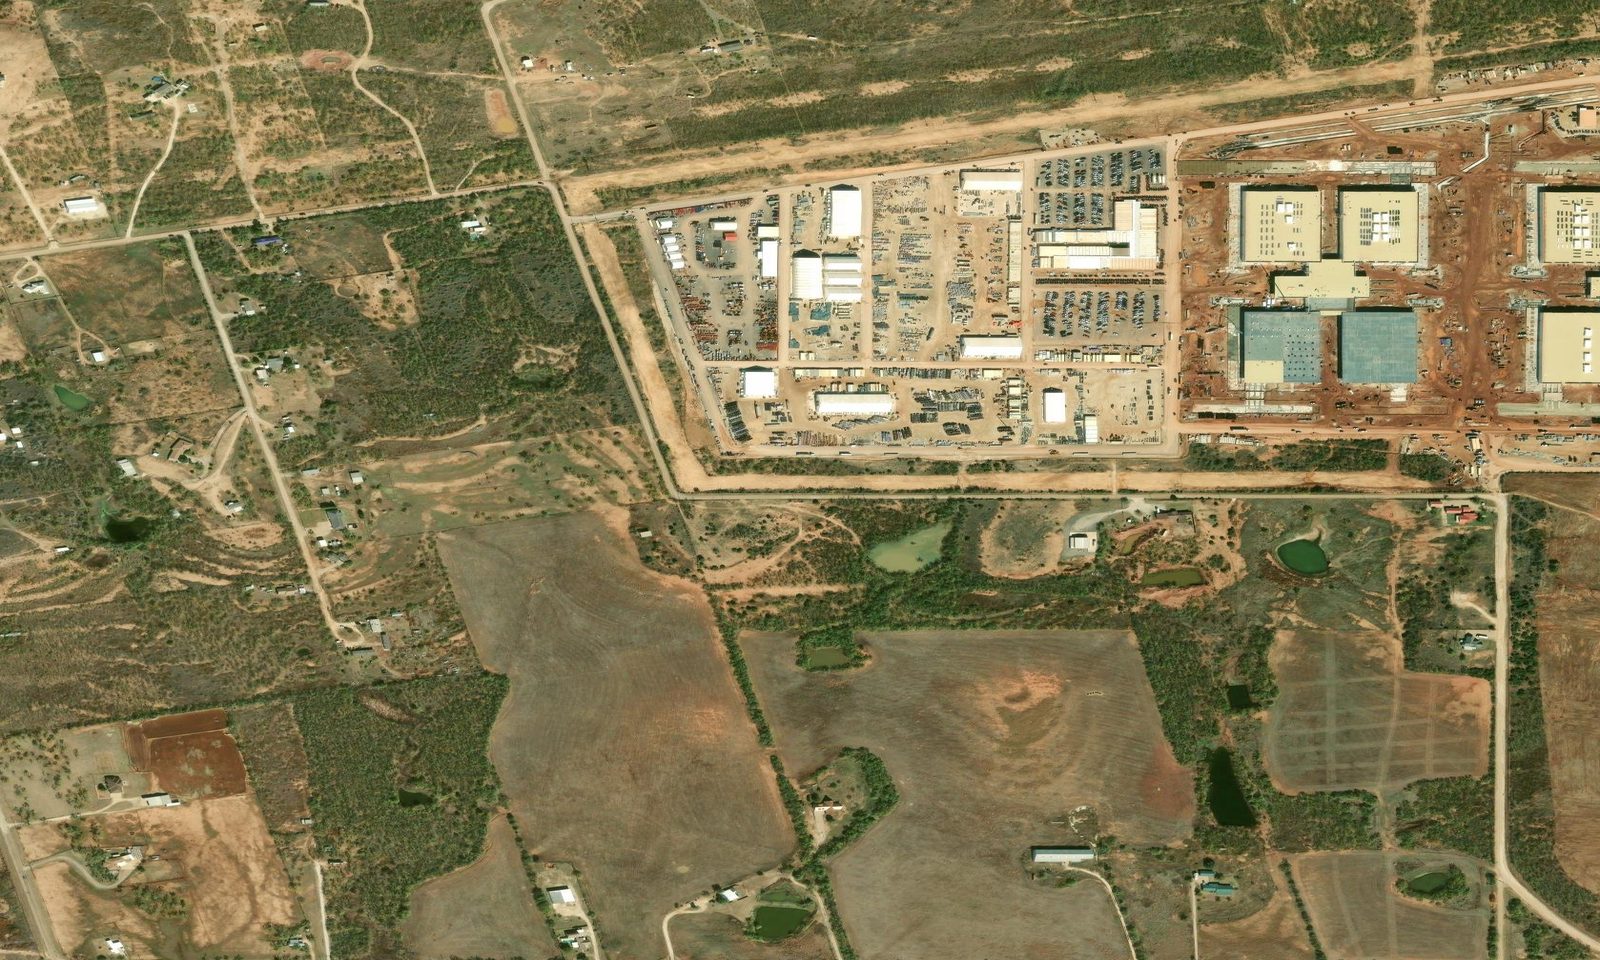
Open farmland on the outskirts of Abilene, announced as the site of the largest AI infrastructure project in history. At full capacity, this single campus would draw more electricity than Pittsburgh.
Meta
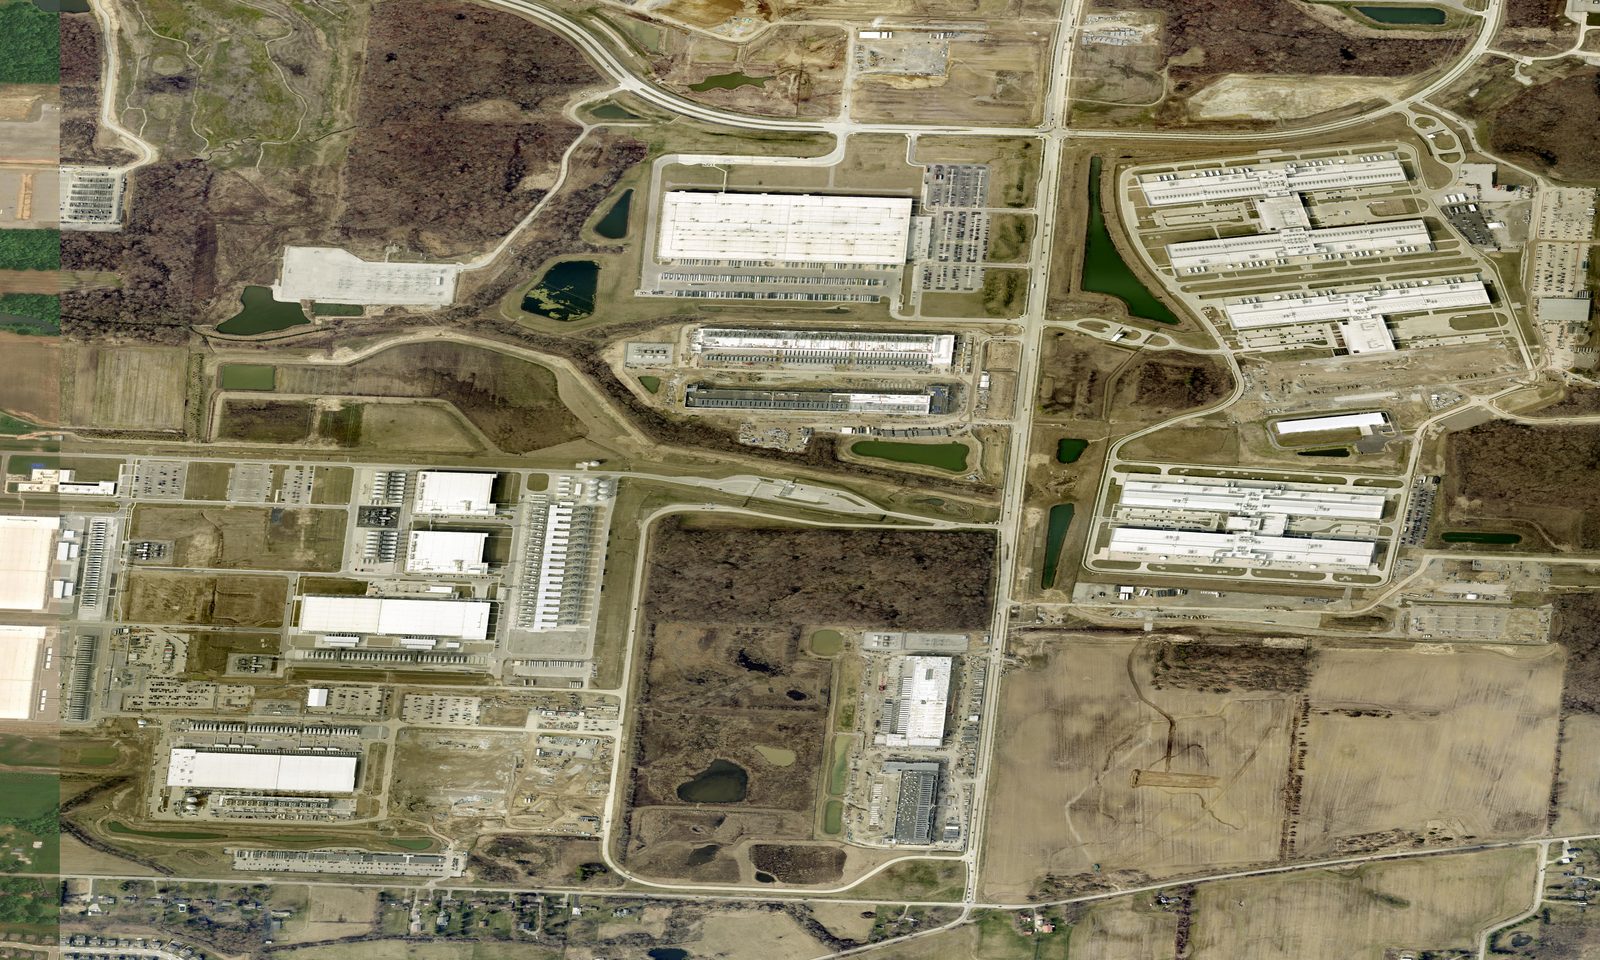
DeKalb, Illinois
Farmland → Meta AI Data Center (2.3M sq ft)
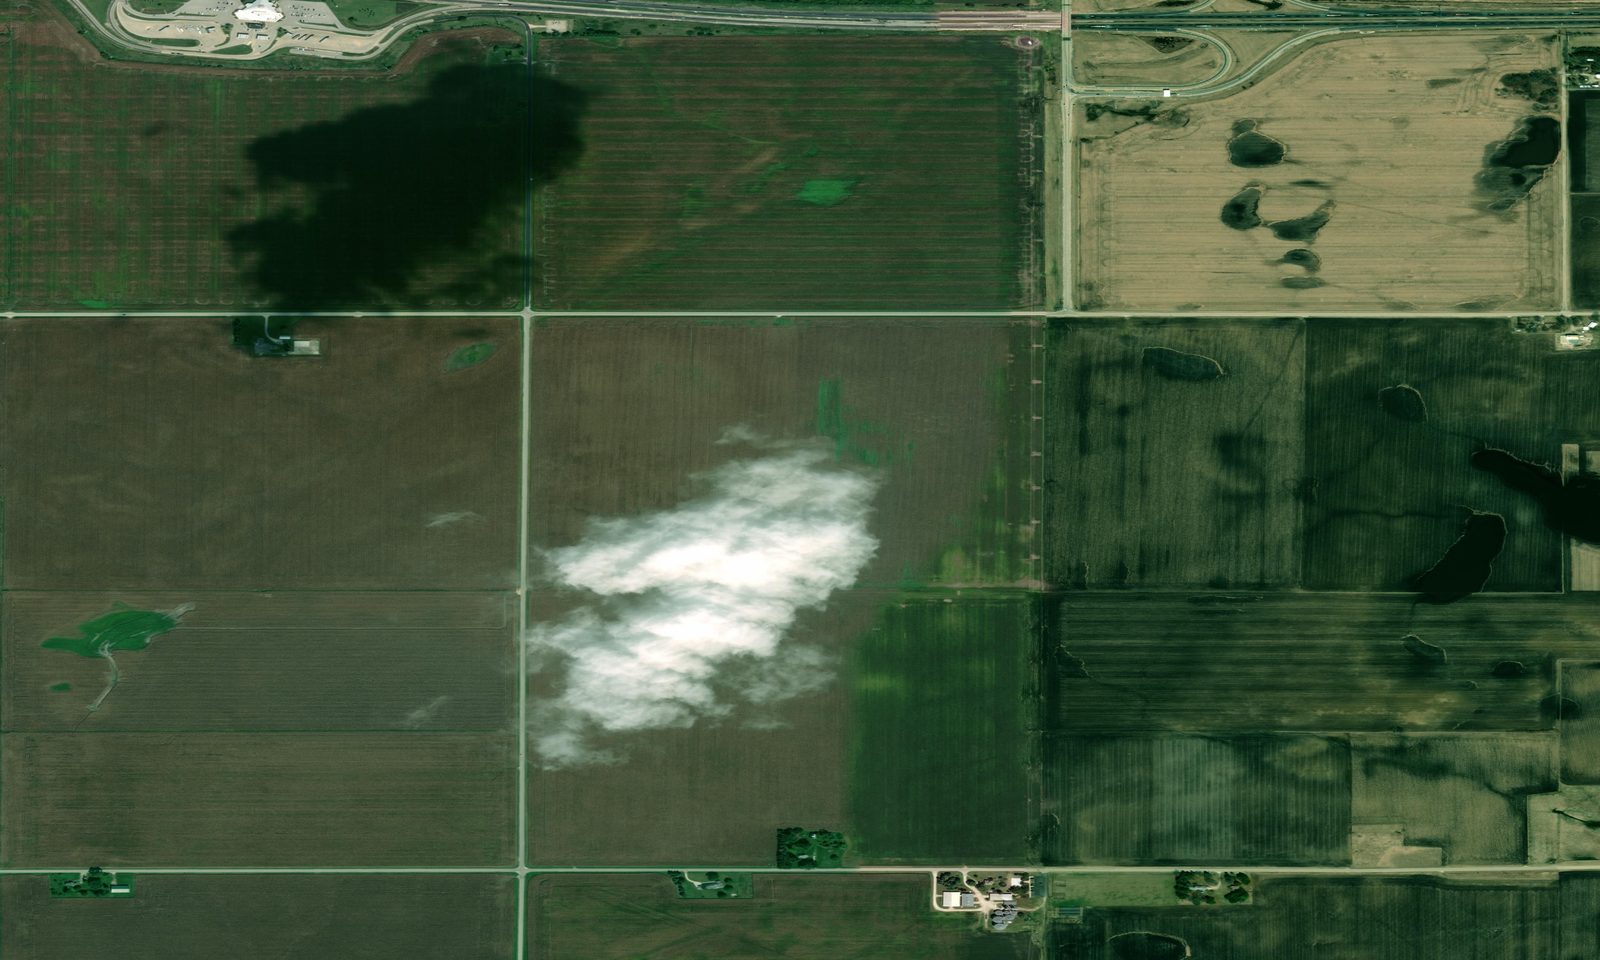
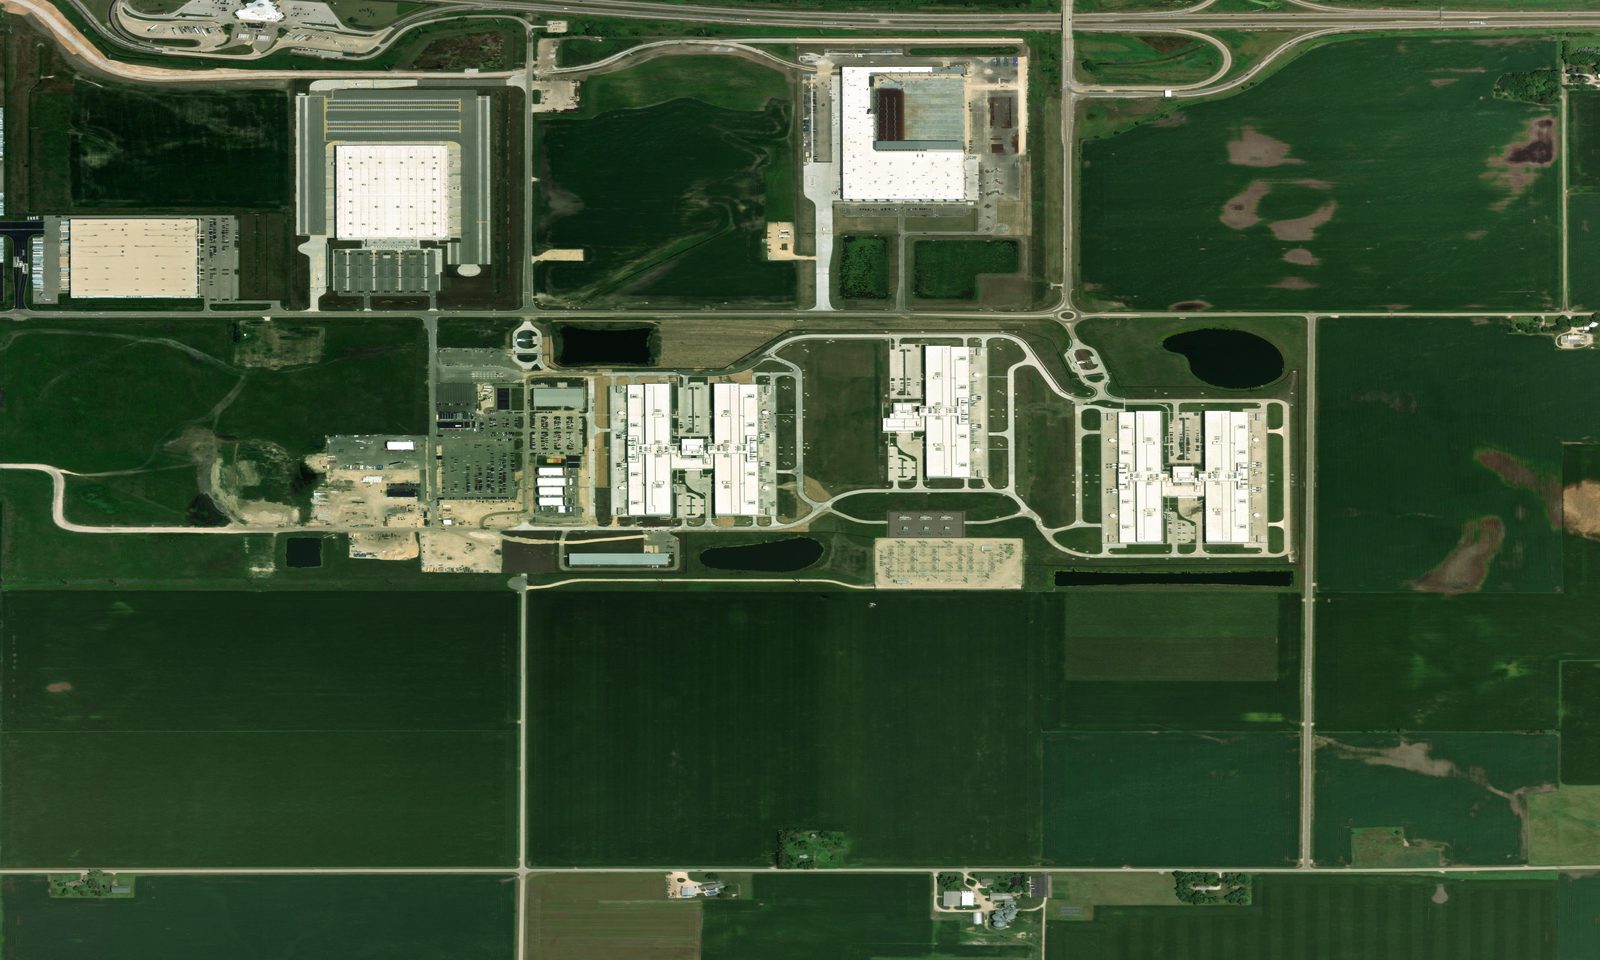
505 acres of Illinois farmland became one of Meta’s largest data centers — a 2.3 million square foot facility completed in 2024, with a 560-acre expansion already proposed next door.
New Albany, Ohio
Farmland → Google Data Center Campus
Ohio farmland northeast of Columbus transformed into one of Google’s expanding data center campuses — part of a wave that has made New Albany a major hub for cloud infrastructure.
Midlothian, Texas
Open Land → Google AI Data Center
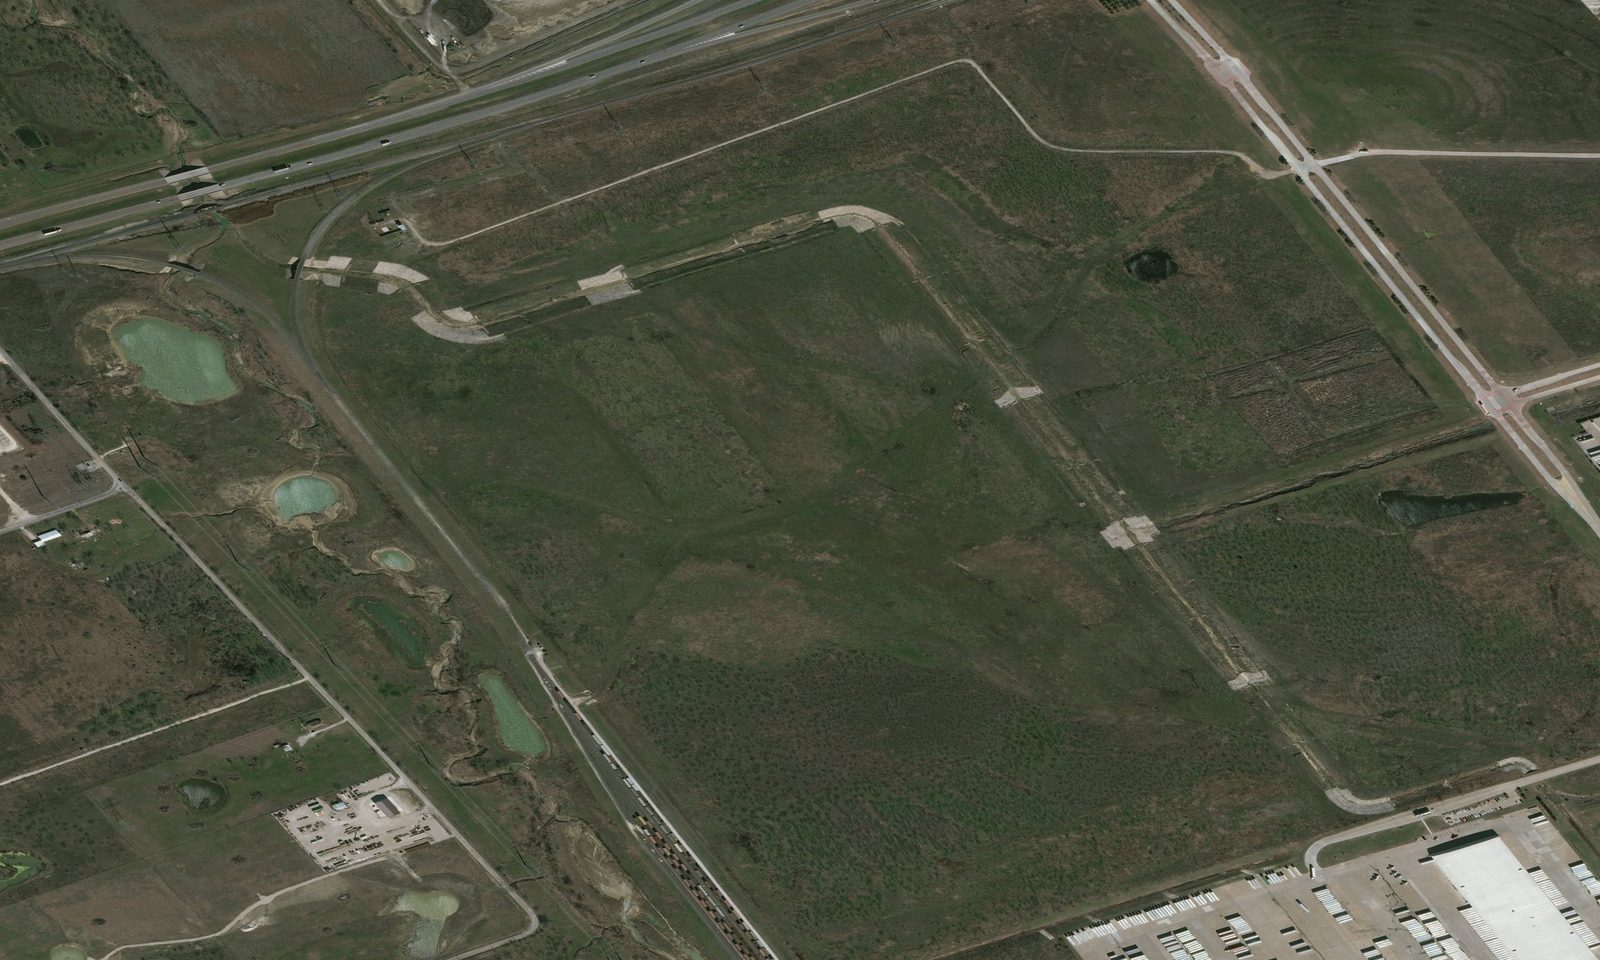
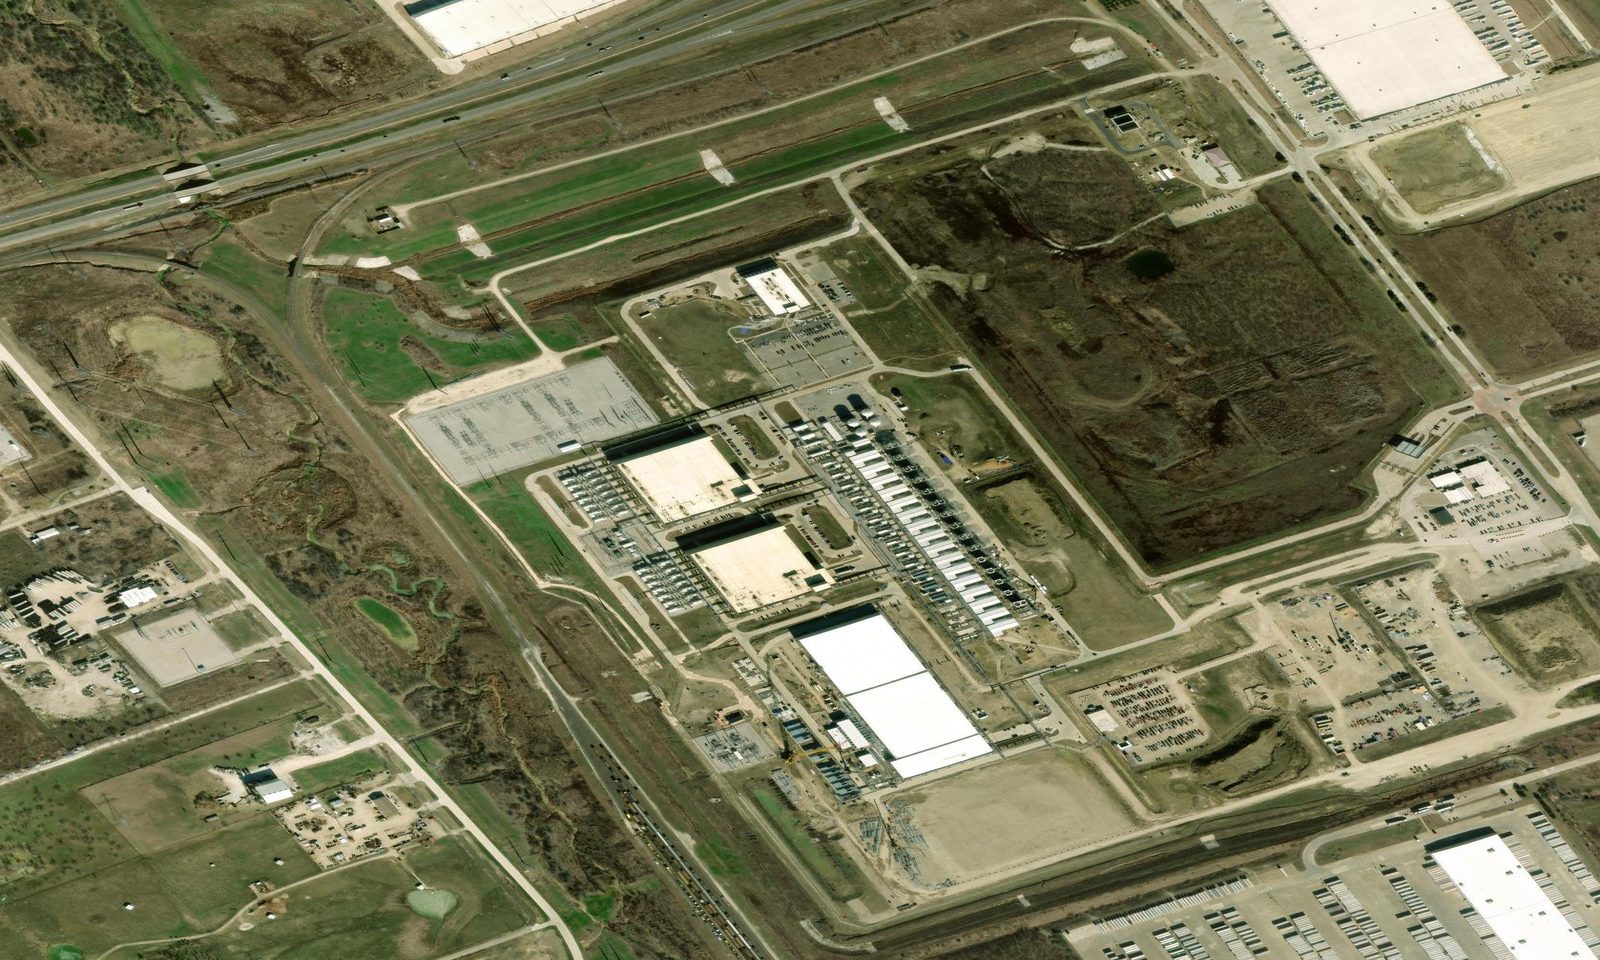
South of Dallas, Google built a major data center campus on previously undeveloped land — part of the company’s multi-billion dollar expansion across Texas.
Power Consumption
Estimated electrical draw by featured site, in megawatts
Sources: Epoch AI facility database, operator filings, EIA interconnection records. 1 MW \u2248 800 homes.
Built in a Hurry
Gigawatt-scale AI data centers are being built in months, not years — an order of magnitude faster than the infrastructure we historically built to power them.
xAI Colossus (in red) went from shuttered appliance factory to 100,000-GPU supercomputer in 122 days. A nuclear reactor of comparable output takes a decade or more. The grid wasn't designed for this pace.
Land Value Transformation
Assessed property value before acquisition vs. current estimated value
Sources: County assessor records, SEC filings, public land records. Values are estimated based on available data.
Who Pays
Behind every AI data center is a package of public subsidies — property tax abatements, infrastructure grants, payment-in-lieu-of-tax deals — negotiated with state and local governments eager for the headline investment figures.
Figures in USD millions, based on publicly reported agreements and available at time of announcement. Actual values vary with assessed property values, employment thresholds, and inflation adjustments. Sources: state EDC filings, Good Jobs First Subsidy Tracker, local news reporting. Values are approximate and should be verified from primary sources before publication.
The National Footprint
AI data center facilities across the United States — shape by operator, color by power draw
Interactive map
Set window.__MAPBOX_TOKEN or add a <meta name="mapbox-token"> tag to activate.
Size scales with power draw. Sites featured in the story above have a white halo and label.